Difference between revisions of "ESE315 Assignment 6"
From atmoschem
| Line 1: | Line 1: | ||
Go through the three Jupyter notebooks in Tutorial 3 careful. Play around with the different Niño indices. Make sure you understand what EOF is and how it is done. | Go through the three Jupyter notebooks in Tutorial 3 careful. Play around with the different Niño indices. Make sure you understand what EOF is and how it is done. | ||
| − | # [ | + | # [10 credits] Calculate the Oceanic Niño Index (ONI) between the years 1982 to 2018. Plot the ONI timeseries. Determine, based on the operation definition of NOAA, the El Niño or La Niña events during this period. Mark these events (you can mark them using python or by hand). |
| − | # [ | + | # [30 credits] Choose the three strongest El Niño events and the three strongest La Niña events during this time period. Make a composite (合成) of the December SST anomaly for the three strongest El Niño events. Make a composite of the December SST anomaly for the three strongest La Niña events. Plot the composite SST anomalies for El Niño and La Niña (Hint: two 2-D maps). |
| + | # [30 credits] Repeat the process of the global SST EOF analysis in tutoral 3. Plot the PC (timeseries) that corresponds to the ENSO phenomenon. Also plot the ONI (timeseries) in the same plot. How are they similar or different to each other? Why are there differences? | ||
| + | # [30 credits] Repeat the process of the global SST EOF analysis in tutoral 3. Plot the EOF (2-D map) that corresponds to the ENSO phenomenon. Compare this map to the El Niño composite map you made in Question 2. Comment on how are they similar or different to each other? Why are there differences? | ||
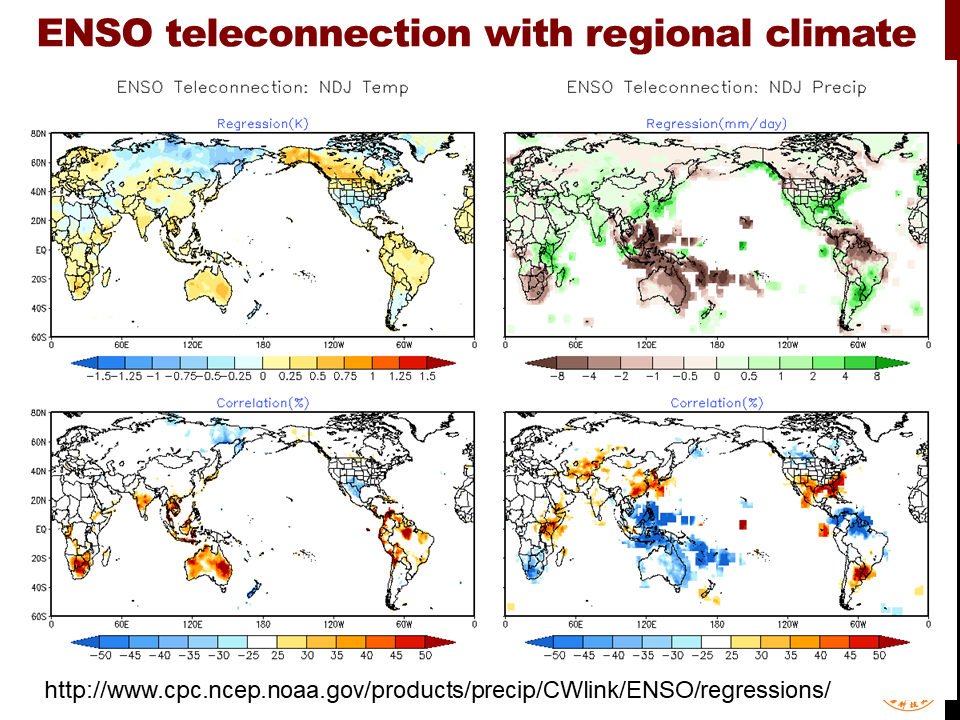
# '''[Extra 20 credits]''' Calculate the November-December (ND) average of ONI for each year between 1982 to 2018. Calculate the correlations between the November-December ONI and the November-December average surface air temperature between 1982 and 2018. Where and how do surface temperature change in association with ENSO? '''''Hint: your plot will be a 2-D map that looks similar to the lower-left panel in following figure.''''' | # '''[Extra 20 credits]''' Calculate the November-December (ND) average of ONI for each year between 1982 to 2018. Calculate the correlations between the November-December ONI and the November-December average surface air temperature between 1982 and 2018. Where and how do surface temperature change in association with ENSO? '''''Hint: your plot will be a 2-D map that looks similar to the lower-left panel in following figure.''''' | ||
[[File:enso_impacts.png]] | [[File:enso_impacts.png]] | ||
Revision as of 12:07, 19 November 2019
Go through the three Jupyter notebooks in Tutorial 3 careful. Play around with the different Niño indices. Make sure you understand what EOF is and how it is done.
- [10 credits] Calculate the Oceanic Niño Index (ONI) between the years 1982 to 2018. Plot the ONI timeseries. Determine, based on the operation definition of NOAA, the El Niño or La Niña events during this period. Mark these events (you can mark them using python or by hand).
- [30 credits] Choose the three strongest El Niño events and the three strongest La Niña events during this time period. Make a composite (合成) of the December SST anomaly for the three strongest El Niño events. Make a composite of the December SST anomaly for the three strongest La Niña events. Plot the composite SST anomalies for El Niño and La Niña (Hint: two 2-D maps).
- [30 credits] Repeat the process of the global SST EOF analysis in tutoral 3. Plot the PC (timeseries) that corresponds to the ENSO phenomenon. Also plot the ONI (timeseries) in the same plot. How are they similar or different to each other? Why are there differences?
- [30 credits] Repeat the process of the global SST EOF analysis in tutoral 3. Plot the EOF (2-D map) that corresponds to the ENSO phenomenon. Compare this map to the El Niño composite map you made in Question 2. Comment on how are they similar or different to each other? Why are there differences?
- [Extra 20 credits] Calculate the November-December (ND) average of ONI for each year between 1982 to 2018. Calculate the correlations between the November-December ONI and the November-December average surface air temperature between 1982 and 2018. Where and how do surface temperature change in association with ENSO? Hint: your plot will be a 2-D map that looks similar to the lower-left panel in following figure.
