ESE315 Assignment 6
From atmoschem
Go through the three Jupyter notebooks in Tutorial 3 carefully. Play around with the different Niño indices. Make sure you understand what EOF is and how it is done.
- [10 credits] Calculate the Oceanic Niño Index (ONI) between the years 1982 to 2018. Plot the ONI timeseries. Determine, based on the operational definition of NOAA (see bottom of this page), the El Niño or La Niña events during this period. Mark these events (you can mark them either using python or by hand).
- [30 credits] Choose the three strongest El Niño events and the three strongest La Niña events during this time period. Make a composite (合成) of the December SST anomaly for the three strongest El Niño events. Make a composite of the December SST anomaly for the three strongest La Niña events. Plot the composite SST anomalies for El Niño and La Niña (Hint: two 2-D maps).
- [30 credits] Repeat the process of the global SST EOF analysis in tutoral 3. Plot the PC (timeseries) that corresponds to the ENSO phenomenon. Also plot the ONI (timeseries) in the same plot. How are they similar to or different from each other? Why are there differences?
- [30 credits] Repeat the process of the global SST EOF analysis in tutoral 3. Plot the EOF (2-D map) that corresponds to the ENSO phenomenon. Compare this map to the El Niño composite map (December) you made in Question 2. Comment on how are they similar to or different from each other? Why are there differences?
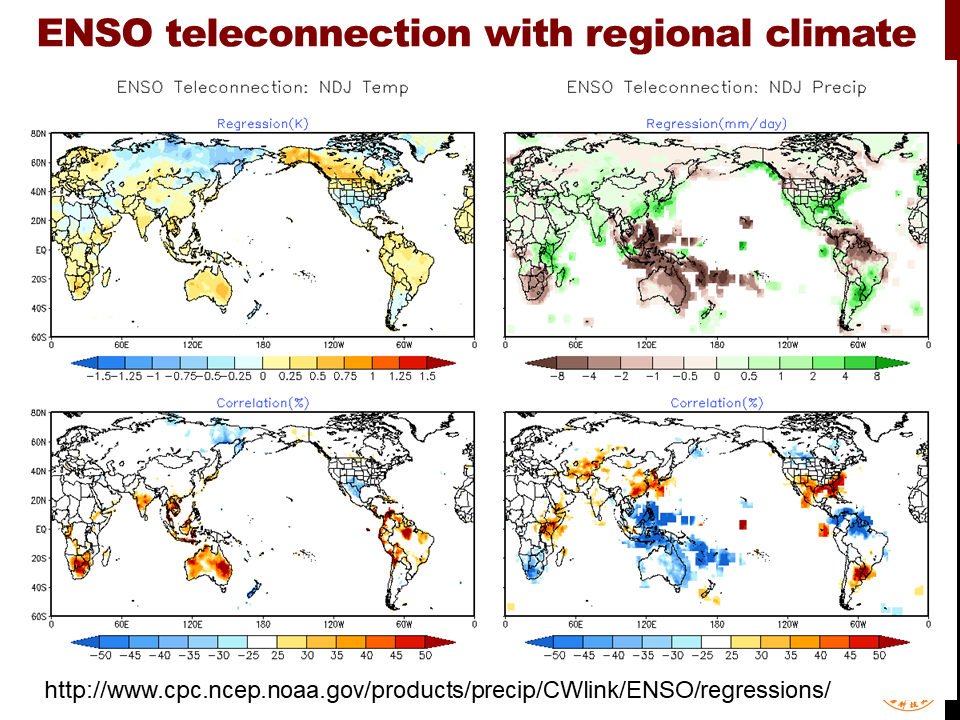
- [Extra 30 credits] Calculate the November-December (ND) average of ONI for each year between 1982 to 2018. Calculate the correlations between the November-December ONI and the November-December average surface air temperature between 1982 and 2018 for all places in the World. Where and how do surface temperature change in association with ENSO? Hint: your plot will be a 2-D map that looks similar to the lower-left panel in following figure.
Notes about the Niño indices
- Niño 1+2 (0-10S, 90W-80W):
The Niño 1+2 region is the smallest and eastern-most of the Niño SST regions, and corresponds with the region of coastal South America where El Niño was first recognized by the local populations. This index tends to have the largest variance of the Niño SST indices.
- Niño 3 (5N-5S, 150W-90W):
This region was once the primary focus for monitoring and predicting El Niño, but researchers later learned that the key region for coupled ocean-atmosphere interactions for ENSO lies further west (Trenberth, 1997). Hence, the Niño 3.4 and ONI became favored for defining El Niño and La Niña events.
- Niño 3.4 (5N-5S, 170W-120W):
The Niño 3.4 anomalies may be thought of as representing the average equatorial SSTs across the Pacific from about the dateline to the South American coast. The Niño 3.4 index typically uses a 5-month running mean, and El Niño or La Niña events are defined when the Niño 3.4 SSTs exceed +/- 0.4C for a period of six months or more.
- Niño 4 (5N-5S, 160E-150W):
The Niño 4 index captures SST anomalies in the central equatorial Pacific. This region tends to have less variance than the other Niño regions.
- ONI (5N-5S, 170W-120W):
The ONI (Oceanic Niño Index) uses the same region as the Niño 3.4 index. The ONI uses a 3-month running mean, and to be classified as a full-fledged El Niño or La Niña, the anomalies must exceed +0.5C or -0.5C for at least five consecutive months. This is the operational definition used by NOAA.
- Usually the anomalies are computed relative to a base period of 30 years.
- This page was last modified on 21 November 2019, at 15:27.
- This page has been accessed 6,685 times.
